A few years ago, an ice-sheet model grabbed attention when it projected much faster losses of Antarctic ice and, subsequently, faster sea level rise. Understanding how quickly Antarctica dumps ice into the ocean is the biggest issue in sea level science—the current range of possibilities is huge and includes remarkable rates of sea level rise that continue for centuries once started. And those sorts of possibilities have huge implications for societies around the globe.
The ice-sheet model that produced disturbing projections included new physical processes in its equations—they were obviously impactful, but their significance in the real world remains uncertain. Later research cast doubt on its most extreme scenarios, but the Antarctic crystal ball hasn’t gotten a lot clearer.
A pair of new studies published in Nature this week mark a new state of the art in ice modeling. Big questions about what we can expect are still there, and so planning for future sea level rise is still very much a matter of weighing risk under uncertainty.
Instabilities
The first study—led by Robert DeConto at the University of Massachusetts Amherst—describes the latest version of that worrisome Antarctic model we mentioned at the start. The model attempts to account for the spontaneous collapse of excessively tall cliffs of ice at the front of glaciers, as well as the pressure-driven expansion of deep cracks that fill with meltwater. The effect of these processes can be amplified in settings like the West Antarctic Ice Sheet, where significant areas of glacial ice sit on bedrock that drops in elevation as you move inland—ultimately dropping well below sea level. Once ice in this situation destabilizes, water can get under it, and it can retreat unstoppably until the bedrock slopes up again.
The model was fed several greenhouse gas-emissions scenarios relevant to recent international talks: futures in which warming is halted at 1.5°C, 2°C, and 3°C (which current pledges have us roughly on track for). The model was also fed a scenario in which unabated warming crosses 4°C before the end of this century. Interestingly, it also includes a series of scenarios where growing emissions halt and suddenly flip into active removal of atmospheric CO2 in 2030, 2040, or 2050, and so on.
Because of the uncertainty in some simulated processes, like ice-cliff instability and hydrofracturing, almost 200 configurations of the model were employed, each with knobs turned slightly differently. Each configuration was tossed if it couldn’t simulate a close match to several historical periods, leaving about 110 configurations to provide a range of results for each greenhouse gas-emissions scenario.
Overall, the revisions in the latest version have apparently led to simulations that produce slightly less extreme rates of ice loss, at least. The 3°C warming scenario jumps out as a transition point. With warming limited to 1.5 or 2°C, the rate of Antarctic ice loss is nearly linear this century. But in both of the higher warming scenarios, ice loss shifts into another gear around 2060 as significant portions of the ice sheet are destabilized. That remains true in scenarios where we follow the 3°C trajectory but aggressively remove CO2 from the atmosphere sometime after the 2060s. The amount of Antarctic ice loss seen by 2100 doubles despite those efforts.
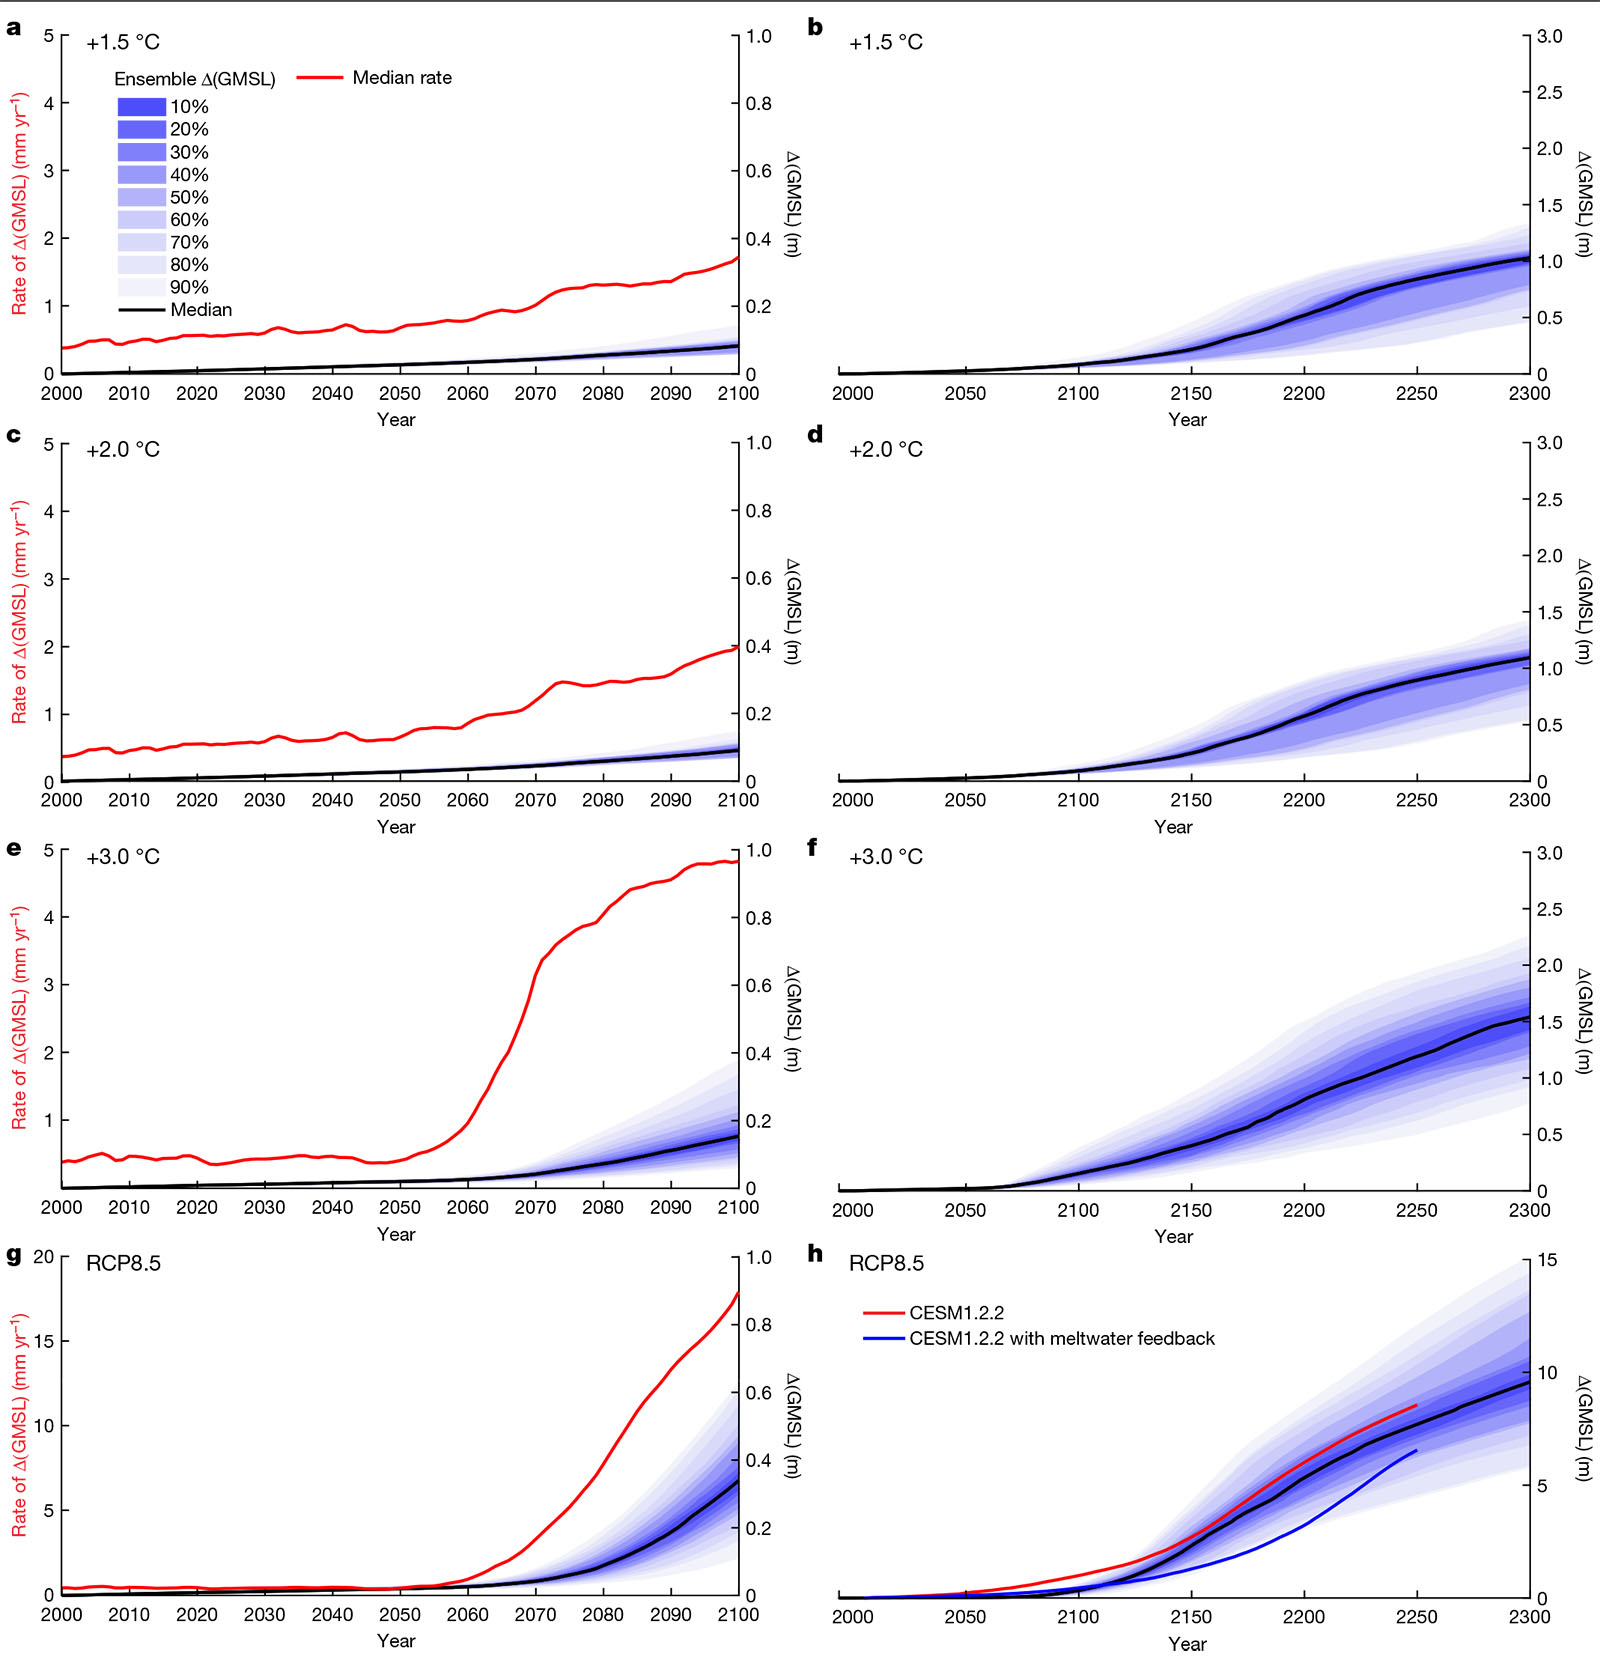
In the 1.5 and 2°C scenarios, Antarctica contributes (on average) about 8 centimeters of sea level rise by 2100 and a bit more than 50 centimeters by 2200. In the 3°C scenario, it’s around 15 centimeters by 2100 and 80 centimeters by 2200.
In the highest emissions scenario, those numbers climb over 30 centimeters by 2100 and well over five meters by 2200.
Don’t emulate this behavior
The second study—led by Tamsin Edwards at King’s College London but involving a total of 84 authors—has a global focus. Because there are multiple groups building climate models of various kinds, there are frequent “intercomparison projects” in which everyone’s model runs the same set of simulations so that the results are directly comparable. This has been done for glacial-ice models in recent years.
Like a similar study we covered, this one uses an “emulation” technique that extracts the statistical characteristics of the model results so they can be analyzed in new ways without running new simulations. One reason for this is that the next IPCC report is being prepared with a new set of future greenhouse gas-emissions scenarios, while these ice-sheet models were run using the old scenarios. Emulation allows those results to be sort of scaled for the slight differences between the scenarios. It also allows for a consistent calculation of error bars—useful for a large compilation like this.
The average results of all these models show around 25 centimeters of global land-ice contribution to sea level rise by 2100 in the 3°C warming scenario—the one that current emissions pledges have us on track for. Limiting warming to 1.5°C instead, as countries have discussed in negotiations (but shown little ambition for), would reduce that contribution to around 13 centimeters by 2100.
(Keep in mind that land ice melt isn’t the only cause of sea level rise—the expansion of seawater as it warms is responsible for around half of sea level rise so far. The last IPCC report projected about 15-30 centimeters of sea level rise this century due to thermal expansion, depending on the warming scenario.)
If you’re scrolling up and struggling to marry these numbers to the first study, it’s because the average Antarctic contribution here is small—around 4 centimeters regardless of the scenario. And the model described above wasn't used for this comparison project.
Avoiding the drunks
Recognizing this Antarctic uncertainty, this study creates an alternate set of scenarios using pessimistic assumptions for Antarctica. These “risk-averse projections” emphasize the worst-case simulations instead of the median. These scenarios shift the Antarctic contribution from around four centimeters to around 20 centimeters in 2100—more similar to our first study. In that case, the total global land ice contribution to sea level rise grows from 13-30 centimeters by 2100 to 30-48 centimeters.
The lower set of numbers is pretty similar to the projections in the 2013 IPCC report, while the second set of numbers is a bit higher. But it's still progress. Whereas that report had to sort of wave its hands and say “it could be much worse,” the risk of higher sea level rise—if a large portion of Antarctic ice destabilizes, for example—has been better explored in the years since.
Still, future sea level rise is fundamentally uncertain. There’s a reason Richard Alley (an author on the first study) has described Antarctic glaciers as the “drunk drivers” of sea level rise—a low-probability but dangerous risk we work to manage on the roadways.
That means thinking about risk has to be at the center of the conversation about sea level rise. As the authors of the second study write, “Given this large range (between 13 centimetres [sea level rise] using the main projections under 1.5 degrees Celsius warming and 42 centimetres [sea level rise] using risk-averse projections under current pledges), adaptation planning for twenty-first-century sea level rise must account for a factor-of-three uncertainty in the land ice contribution until climate policies and the Antarctic response are further constrained.”
Nature, 2020. DOI: 10.1038/s41586-021-03427-0, 10.1038/s41586-021-03302-y (About DOIs).
reader comments
71