
Does the Yield Curve Really Forecast Recession?
It's well known that in the United States recessions are often preceded by an inversion of the yield curve. Is there any economic rationale for this?
Most yield curve analysis refers to nominal interest rates. Economic theory, however, stresses the relevance of real (inflation-adjusted) interest rates. According to standard asset-pricing theory, the real interest rate measures the rate at which consumption is expected to grow over a given horizon.1 A high 1-year yield signals high expected growth over a 1-year horizon. A high 10-year yield signals high expected growth over a 10-year horizon. If the difference between the 10-year yield and 1-year yield is positive, then growth is expected to accelerate. If the difference is negative—that is, if the real yield curve inverts—then growth is expected to decelerate.
What is the economic intuition for these claims? One way to think about this is in terms of Friedman's permanent income hypothesis, which states that an individual's desired consumption expenditure today should depend not only on current income, but also on the likely path of his or her income over the foreseeable future.2 According to this theory, if people expect higher future income, then they will want to consume more today to smooth out their consumption. They can attempt to do so by saving less (or borrowing more). If a community is collectively "bullish" in this sense, desired consumer spending should rise in the aggregate and desired saving should fall, leading to upward pressure on the real interest rate.
Now, consider an economy that grows over time but where growth occurs unevenly (i.e., the economy alternates between high- and low-growth regimes). Imagine, as well, that the economy is occasionally buffeted by negative "shocks"—adverse events that occur at unpredictable moments (an oil price spike, a stock market collapse, etc.). In such an economy, recession is more likely to occur when a negative shock of a given size occurs in a low-growth state as opposed to a high-growth state.
Next, suppose that an inverted yield curve forecasts a deceleration in growth. Then the deceleration will entail moving from a higher-growth state to a lower-growth state. Suppose this lower-growth state is near zero. In this state, growth is now more likely to turn negative in the event of a shock. In this way, an inverted yield curve does not forecast recession; instead, it forecasts the economic conditions that make recession more likely.
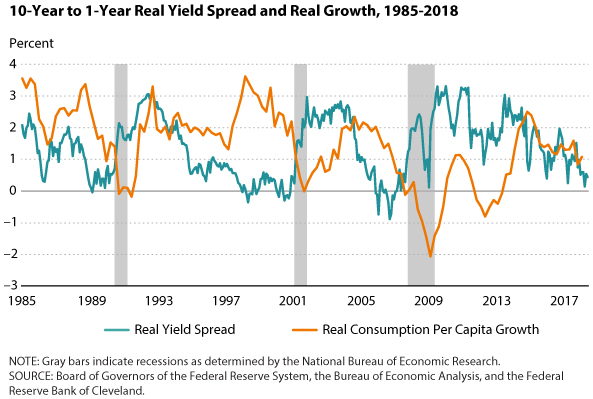
How does this idea match with the data? The figure plots the 10-year to 1-year real yield spread along with the year-over-year growth rate of real per capita consumption (excluding durables).3
As is clear from the figure, the real yield curve flattened and inverted prior to each of the past three recessions. Consistent with the theory, consumption growth tends to decelerate as the yield curve flattens. This is true even in non-recessionary episodes. In particular, the consumption growth decelerations of 1985-86, 1988-89, and 2006-07 were each associated with or preceded by a flattening or inverted yield curve. Each of the three recessions occurred when consumption was growing at a moderate to low pace.
Were the recessions that occurred following a yield curve inversion forecastable? The proximate cause of the 1990 recession was the Iraqi invasion of Kuwait and the associated spike in world oil prices. The proximate cause of the two most recent recessions—2001 and 2007-09—were asset-price collapses. It seems unlikely that the timing of these events could be forecasted with precision. According to the interpretation here, the severity of the Great Recession of 2007-09 was in part due to the fact that the economy was already growing slowly at the time of the collapse in real estate prices. While consumption growth did slow prior to the collapse of the "dot com" asset price bubble in 2000, it grew at a moderate rate entering that recession. Accordingly, the recession of 2001 is one of the mildest on record.
Conclusion
Does the recent flattening of the yield curve portend recession? Not necessarily. The flattening of the real yield curve may simply reflect the fact that real consumption growth is not expected to accelerate or decelerate from the present growth rate of about 1 percent year over year. On the other hand, a 1 percent growth rate is substantially lower than the U.S. historical average of 2 percent. Because of this, the risk that a negative shock (of comparable magnitude to past shocks) sends the economy into technical recession is increased. While the exact date at which the shock arrives is itself unpredictable, the likelihood of recession is higher relative to a high-real-interest-rate, high-growth economy.
Notes
1 See Lucas, Robert E. "Asset Prices in an Exchange Economy." Econometrica, November 1978, 46(6), pp. 1429-45.
2 See Friedman, Milton. "The Permanent Income Hypothesis," in Milton Friedman, ed., A Theory of the Consumption Function. Princeton, NJ: Princeton University Press, 1957, pp. 20-37.
3 The 1-year real rate is calculated by subtracting the 1-year expected inflation rate from the yield on a nominal 1-year U.S. Treasury; the 10-year real rate is calculated in an analogous manner. Inflation expectations are calculated by the Federal Reserve Bank of Cleveland; https://www.clevelandfed.org/our-research/indicators-and-data/inflation-expectations.aspx.
© 2018, Federal Reserve Bank of St. Louis. The views expressed are those of the author(s) and do not necessarily reflect official positions of the Federal Reserve Bank of St. Louis or the Federal Reserve System.